
eFORGE v1.2 > Documentation
eFORGE analysis tool |
| The eFORGE (experimentally-derived Functional element Overlap analysis of ReGions from EWAS) tool performs a Functional Overlap analysis to identify tissue specific signal for a given set of EWAS DMPs. |
Overview |
| The eFORGE tool provides a method to view the tissue specific regulatory component of a set of EWAS DMPs. eFORGE analysis takes a set of DMPs, such as those hits above genome-wide significance threshold in an EWAS study, and analyses whether there is enrichment for overlap of putative functional elements compared to matched background DMPs. It assesses enrichment on a per cell type basis, since functional elements are differentially active in different cell types, and hence can expose tissue-specific signals of enrichment for the given test DMP set. This can reveal the sites of action underlying the EWAS signal, and provide confirmation of the validity of the EWAS where a tissue-specific mechanism is known or expected for the phenotype. Conversely unknown tissue involvements can also be revealed. |
| In the initial implementation, the functional elements considered are DNase I hotspots from either the ENCODE or Roadmap Epigenomics projects generated by the Hotspot method. The hotspots are regions of general DNase I sensitivity (rather than peaks which are more similar to DNase hypersensitive sites). |
| For each set of test DMPs, an overlap analysis is performed against the functional elements from either data source for each cell sample separately (125 samples for ENCODE, 299 for Roadmap), and the number of overlaps is counted. A background distribution of the expected overlap counts for this DMP set is obtained by picking sets of the same number of DMPs as the test DMP set, matched for gene relationship and CpG island relationship annotation. The matched background sets are then overlapped with the functional elements and the background distribution of overlaps determined. By default 1000 matched sets are used. The enrichment value for the test DMP set is expressed as the -log10 (binomial p value). Enrichments outside the nominal 95th and 99th percentile (by default) of the binomial distribution (after Benjamini-Yekutieli multiple testing correction) are considered significant. A schematic of the analysis is shown below. |
| eFORGE Analysis Strategy |
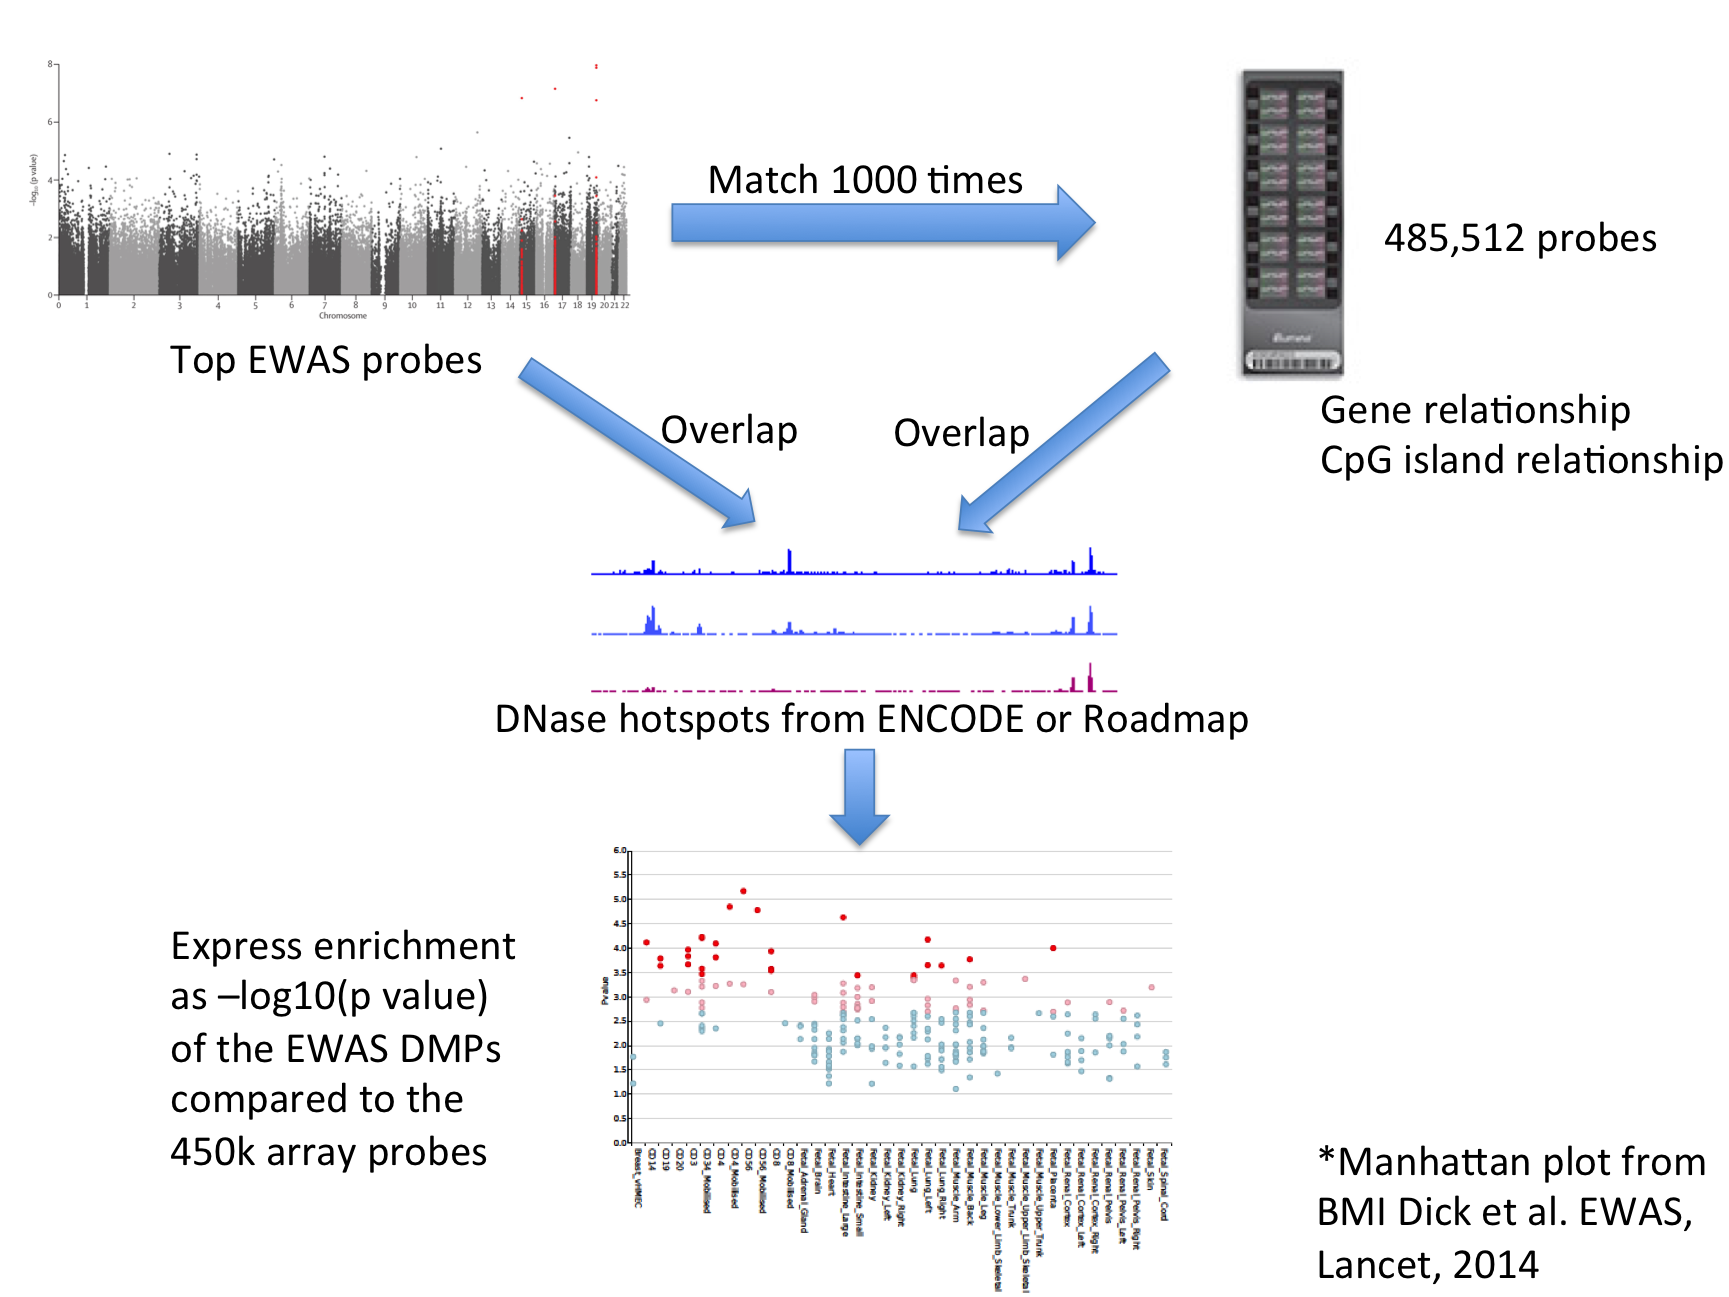 |
| The results are presented by cell sample in either graphic (interactive Dimple chart or static pdf) or tabular (interactive DataTables table or tab separated file) forms. Typical results may show an enrichment of overlap (red or pink points) for the EWAS DMP set in a tissue of mechanistic relevance to the phenotype under analysis, for instance blood cell subtypes for Rheumatoid Arthritis DMPs. |
| Alternatively there may be no enrichment and all points will be blue below the -log10 (binomial p value) thresholds. This could be because there is no regulatory component underlying the EWAS association, or because the relevant tissue is not present in the available functional element datasets, or for other technical reasons (e.g. too few overlaps). |
| A list of probes from a tDMR study by Jaffe and Irizarry (Genome Biology, 2014) is available as default data in the web tool and more example datasets are being considered for a catalogue of eFORGE analysis results. |
Methods |
| Data ENCODE consortium hotspots were obtained from here. Roadmap Epigenome DNase I sequencing tag alignments were obtained from here. These were processed by the Hotspot method to give hotspot files using the default parameters. Cell and Tissue assignments were obtained by custom perl scripts using data from ENCODE Data Coordination Center tables or BioSamples. |
| Overlaps DNase I hotspot data in bed/wig format was formatted for overlap analysis using Tabix. The standard Illumina annotation file for all the probes on the 450k array was obtained and overlaps with the DNase I elements by cell type for every probe were calculated using Tabix in a distributed approach on the EBI compute farm. Overlaps were stored as a binary string for each data set (ENCODE or Roadmap) for each 450k probe in an indexed Tabix database, eforge.db. |
| eFORGE analysis For a given set of DMPs eFORGE queries the sqlite database and retrieves all overlap bit strings. It then unpacks the bitstrings for each DMP and counts the overlaps per cell type. It next identifies matching probes for the DMPs based on gene relationship and CpG Island relationship, and repeats the overlap analysis for each background set. The final step is a simple calculation of the -log10 (binomial p value) of the test overlap count versus the background distribution. |
| Outputs The TSV output is generated by eFORGE during processing. The graphic and tabular outputs are all generated via R code embedded in eFORGE. The pdf output is generated with base R code graphics. The interactive table is produced using the Datatables plug-in for the jQuery Javascript library accessed through the rCharts package. The interactive graphic is a dimple d3 interactive graphic again using the rCharts package. |
| Estimating False Positive Rates by DMP count in the Test DMP Set To estimate false positive rates, 1000 randomly chosen DMP sets for each of a series of DMP counts between 10 and 300 DMPs were analysed using eFORGE on the Roadmap and ENCODE data. The false positive rate was calculated as the number of cell enrichments greater than the two standard thresholds used by eFORGE expressed as the proportion of the total number of cell overlap tests performed. |
False Positive Rate by DMP set Count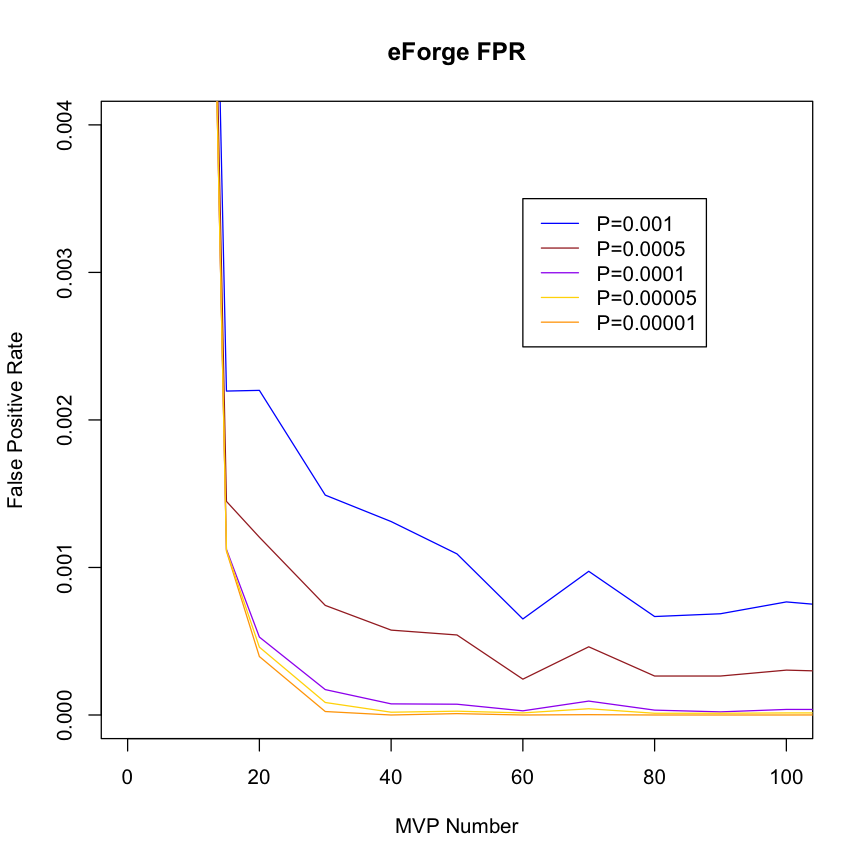 This plot suggests that for a DMP set of >= 20, a threshold of -log10 (binomial p value) >= 3.38 (equivalent to 0.001 in corrected p value) maintains the false positive rate below around 0.0025 (0.25%). |
Versions |
| v1.2 This version includes DHS data from the BLUEPRINT Consortium. |
| v1.1 Version 1.1 adds both DHS and Histone marks from the Consolidated Roadmap data to eFORGE analysis. One of the options allows to run eFORGE against all five H3 marks at once. This version also includes new changes under the hood like a redeisgn of the underlying database. |
| v1.0 First version of eFORGE. The tools allows to analyses DMPs versus Epigenome Roadmap and ENCODE DHS. |